By Maia Moran
Earth Day is April 22 and a great time to think about changes we can make in our own lives to support the health of our planet. When it comes to climate change, one of the most meaningful actions we can take is to drive less and get around more by biking, walking and taking forms of public transportation like Muni. Transportation is the largest source of greenhouse gas emissions (GHG) in San Francisco, with personal driving accounting for 72% of the sector’s emissions. By comparison, Muni accounts for about 1% of GHG emissions in and out of the city.
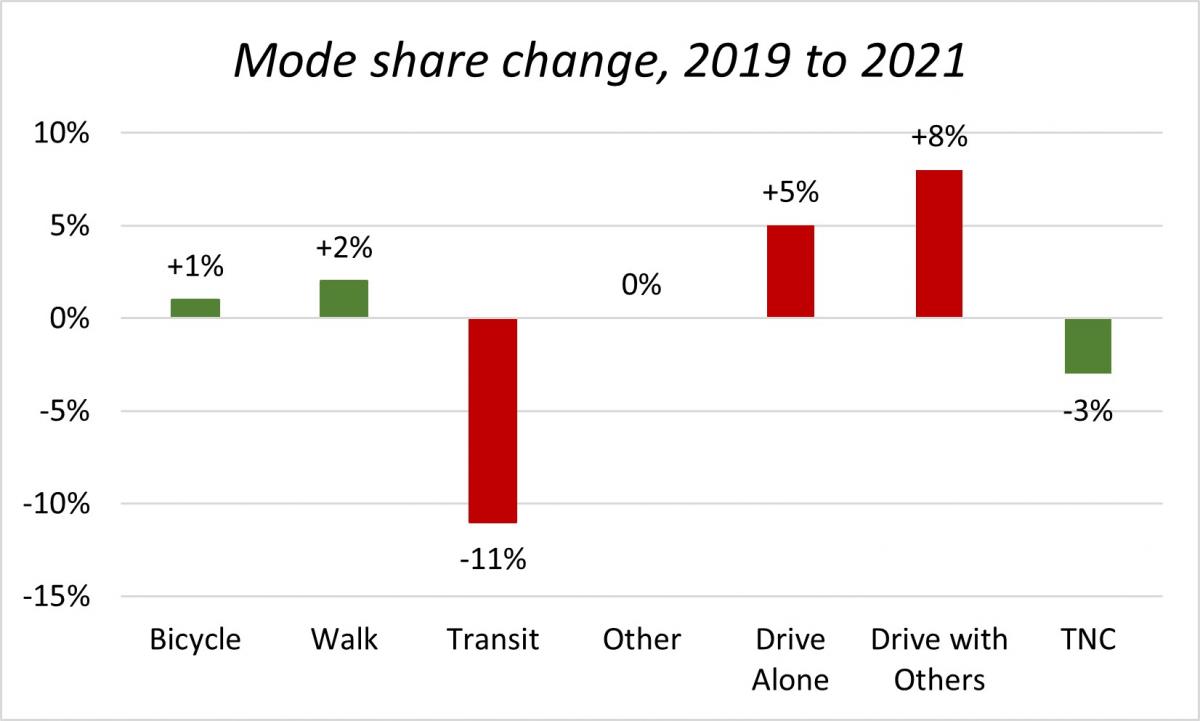
But when it comes to driving less, the San Francisco Bay Area is going in the wrong direction. Public transit use fell by 11% between 2019 and 2021 and private automobile use increased by 13%, according to the results of the 2021 Travel Decision Survey. That’s why we’ve been working so hard to make transit, walking and biking more appealing and convenient with new transit lanes, better ventilation on Muni, protected bike lanes and more.
Travel Decision Survey
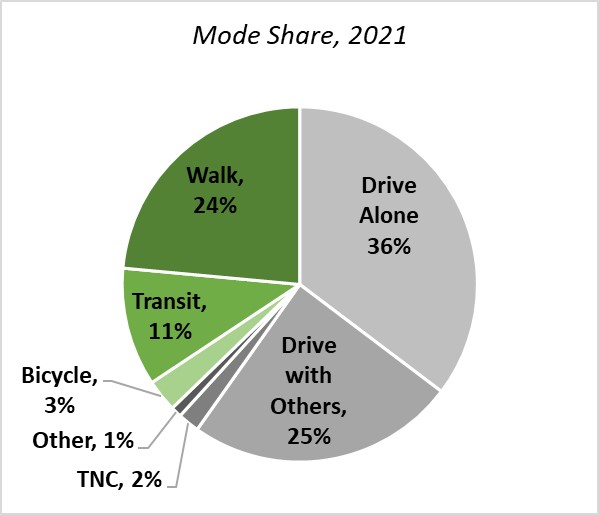
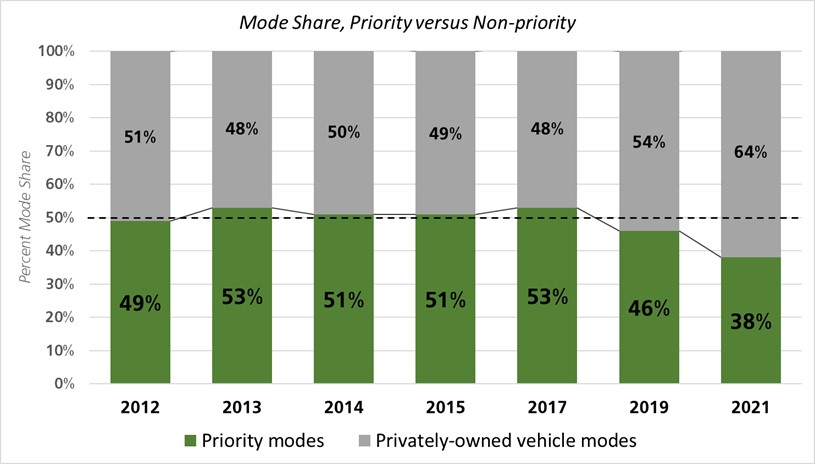
Once every two years, the SFMTA conducts a telephone survey of over 750 Bay Area residents to ask them questions about their daily travel patterns and how they get to destinations in and around San Francisco. Results from the 2021 Travel Decision Survey (TDS) indicate that the COVID-19 pandemic has driven a shift away from our vision for a transit-first city. The survey allows us to understand whether people in San Francisco are traveling by “priority” modes (walking, biking and public transit). Priority modes are those encouraged by San Francisco’s long-standing transit-first policy, which seeks to improve the city’s economy, environment and quality of life. Trips by transportation network companies (TNCs) such as Uber and Lyft, driving with others and driving alone are all categorized as “privately owned vehicle” modes and grouped into one category.

Key Findings
Using San Francisco County Transportation Agency data, the total number of anticipated daily trips decreased from 4.5 million in 2019 to 4.4 million in 2021, consistent with daily travel pattern shifts prompted by the pandemic such as more people working at home and fewer commuting to offices. Despite an agency goal of increasing travel by priority modes, the share for these trips fell from just under half (46%) in 2019 to just under two-fifths (38%) in 2021.

The most significant decrease in travel mode was by public transit, which fell 11% between 2019 and 2021. The most significant increase in travel mode was by private automobile use, including both driving with others (up 8%) and driving alone (up 5%). Walking and biking both had minor increases.

San Francisco residents still used priority modes twice as often as non-residents for trips within San Francisco. Respondents with a household income of $75,000 or less had the highest transit ridership, while a majority of those with incomes over $75,000 chose non-priority modes. Individuals identifying as women or non-binary were more likely to travel by privately owned vehicles than those identifying as men.
The Future of Travel
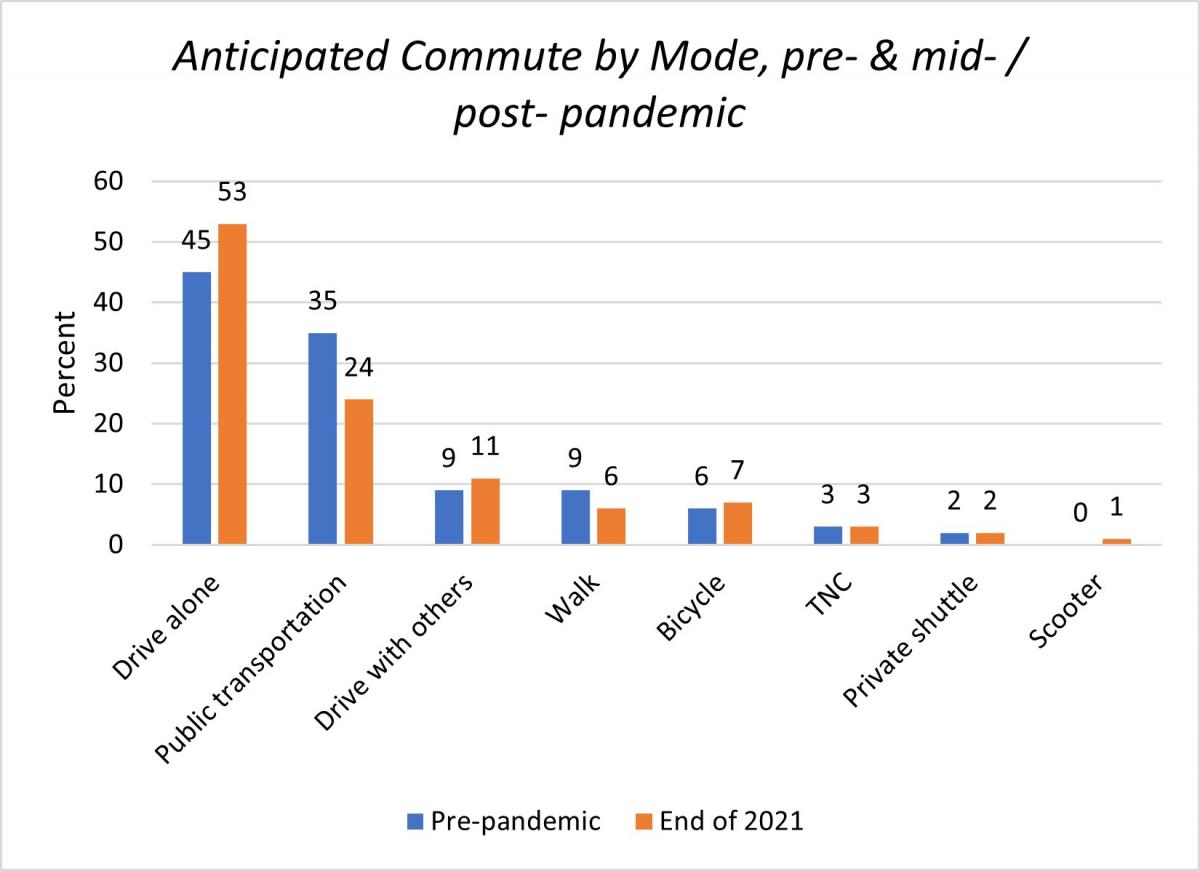
Many of the travel pattern changes revealed by the survey were likely a result of the COVID-19 pandemic, during which many people limited their non-essential travel and worked from home instead of commuting to an office.

But as the city recovers from the effects of the pandemic and travel begins to increase, we urgently need to educate Bay Area residents about how their travel decisions impact our environment. To meet San Francisco’s climate goals, including net zero emissions by the year 2040, it is critical that many of us shift from driving personal vehicles to taking public transit, walking, bicycling and using other “non-carbon” travel modes.
To encourage that shift, the SFMTA has improved the speed and reliability of our most popular bus lines by creating an unprecedented number of transit lanes. We introduced changes to make Muni more equitable. We recently increased the staff presence on Muni vehicles to deter crime and increase safety. We also upgraded our transit fleet HVAC systems, which now turn the air over once every minute. Earlier this month, we launched the Van Ness Bus Rapid Transit Corridor, and later this year the Central Subway extension to Chinatown will be open to one and all.
To complement transit use, we have created safe bicycling and walking routes throughout San Francisco. The city now boasts 42 miles of protected bike lanes and approximately 43 miles of Slow Streets where through traffic is limited. By lowering speed limits and completing Quick Build street improvements, we’ve made walking and bicycling safer and more comfortable.
Now, we need to make sure people in the San Francisco Bay Area know about and take advantage of these improvements.
The 2021 Travel Decision Survey report and results are available to download here.
Published April 19, 2022 at 10:32AM
https://ift.tt/v9gLHZ8

No comments:
Post a Comment